A lightning:input component creates
an HTML input element. This component supports
HTML5 input types, including checkbox, date and datetime-local, email, file, password, search, tel, url,
number, radio, toggle. The default is
text.
You can define a client-side
controller action for input events like onblur,
onfocus, and onchange. For example, to handle a change event on the component when
the value of the component is changed, use the onchange attribute.
This component inherits styling from forms in the Lightning Design
System.
CheckboxCheckboxes let you select one or more
options.
<lightning:input type="checkbox" label="Red" name="red" checked="true"/>
<lightning:input type="checkbox" label="Blue" name="blue" />
A
color picker enables you to specify a color using a color picker or by entering the
color into a text field. The native color picker is
used.
<lightning:input type="color" label="Color" name="color" value="#EEEEEE"/>
An
input field for entering a date. Date pickers don't currently support the Lightning
Design System styling. The date format is automatically validated during the onblur
event.
<lightning:input type="date" label="Birthday" name="date" />
An
input field for entering a date and time. Date pickers don't currently support the
Lightning Design System styling. The date and time format is automatically validated
during the onblur
event.
<lightning:input type="datetime-local" label="Birthday" name="datetime" />
An
input field for entering an email address. The email pattern is automatically
validated during the onblur
event.
<lightning:input type="email" label="Email" name="email" value="abc@domain.com" />
An
input field for uploading files using a Upload
Files button or a drag-and-drop zone. To retrieve the list of selected
files, use event.getSource().get("v.files");.
<lightning:input type="file" label="Attachment" name="file" multiple="true" accept="image/png, .zip" onchange="{! c.handleFilesChange }"/>An
input field for entering a month and year. Date pickers don't currently inherit the
Lightning Design System styling. The month and year format is automatically
validated during the onblur
event.
<lightning:input type="month" label="Birthday" name="month" />
An
input field for entering a number. When working with numerical input, you can use
attributes like max, min, and step.
<lightning:input type="number" name="number" label="Number" value="12345"/>
To
format numerical input as a percentage or currency, set formatter to percent or currency
respectively.
<lightning:input type="number" name="ItemPrice"
label="Price" value="12345" formatter="currency"/>Fields
for percentage and currency input must specify a step increment of 0.01 as required
by the native
implementation.
<lightning:input type="number" name="percentVal" label="Enter a percentage value" formatter="percent" step="0.01" />
<lightning:input type="number" name="currencyVal" label="Enter a dollar amount" formatter="currency" step="0.01" />
An
input field for entering a password. Characters you enter are
masked.
<lightning:input type="password" label="Password" name="password" />
Radio
buttons let you select only one of a given number of
options.
<lightning:input type="radio" label="Red" name="red" value="red" checked="true" />
<lightning:input type="radio" label="Blue" name="blue" value="blue" />
A
slider control for entering a number. When working with numerical input, you can use
attributes like max, min, and step.
<lightning:input type="range" label="Number" name="number" min="0" max="10" />
An
input field for entering a search string. This field displays the Lightning Design
System search utility
icon.
<lightning:input type="search" label="Search" name="search" />
An
input field for entering a telephone number. Use the pattern attribute to define a pattern for field
validation.
<lightning:input type="tel" label="Telephone" name="tel" value="343-343-3434" pattern="[0-9]{3}-[0-9]{3}-[0-9]{4}"/>An
input field for entering text. This is the default input
type.
<lightning:input label="Name" name="myname" />
An
input field for entering time. The time format is automatically validated during the
onblur
event.
<lightning:input type="time" label="Time" name="time" />
A
checkbox toggle for selecting one of two given
values.
<lightning:input type="toggle" label="Toggle value" name="togglevalue" checked="true" />
An
input field for entering a URL. This URL pattern is automatically validated during
the onblur
event.
<lightning:input type="url" label="Website" name="website" />
An
input field for entering a week and year. Date pickers don't currently inherit the
Lightning Design System styling. The week and year format is automatically validated
during the onblur
event.
<lightning:input type="week" label="Week" name="week" />
Client-side input validation is available for this component. For
example, an error message is displayed when a URL or email address is expected for
an input type of url or email.
You can define additional field
requirements. For example, to set a maximum length, use the maxlength
attribute.
<lightning:input name="quantity" value="1234567890" label="Quantity" maxlength="10" />
To
check the validity states of an input, use the validity attribute, which is based on the ValidityState Web API. To determine if a field is valid, you can
access the validity states in your client-side controller. Let's say you have the
following input field.
<lightning:input name="input" aura:id="myinput" label="Enter some text" onblur="{! c.handleBlur }" />The
valid property returns true because all
constraint validations are met, and in this case there are
none.
handleBlur: function (cmp, event) {
var validity = cmp.find("myinput").get("v.validity");
console.log(validity.valid); //returns true
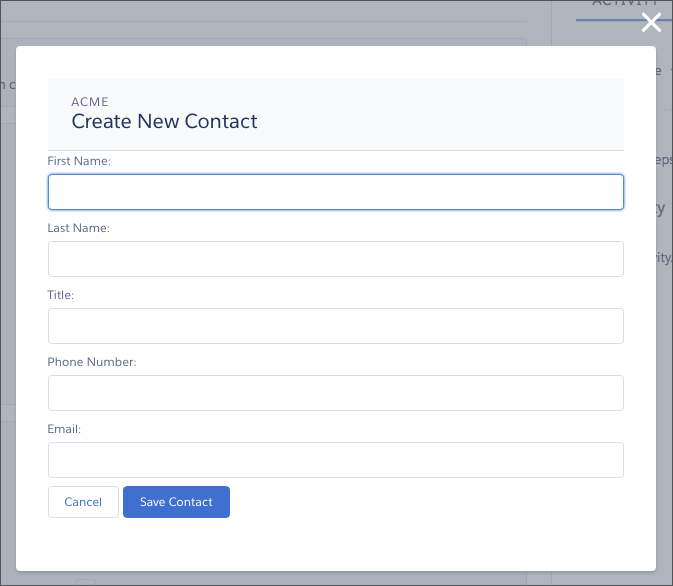
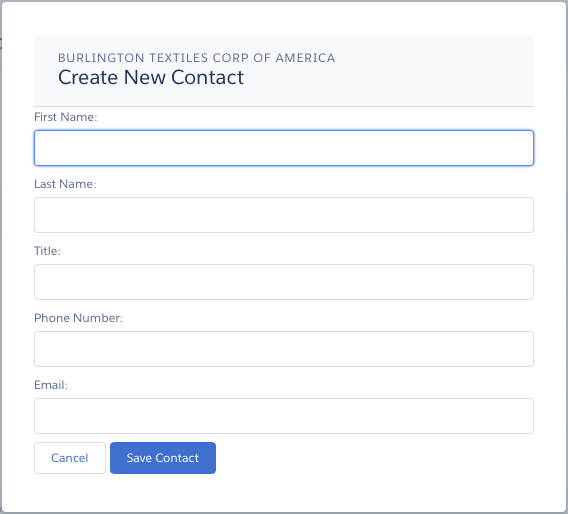
}For
example, you have the following form with several fields and a button. To display
error messages on invalid fields, use the showHelpMessageIfInvalid()
method.
<aura:component>
<lightning:input aura:id="field" label="First name" placeholder="First name" required="true" />
<lightning:input aura:id="field" label="Last name" placeholder="Last name" required="true" />
<lightning:button aura:id="submit" type="submit" label="Submit" onclick="{! c.onClick }" />
</aura:component>Validate
the fields in the client-side
controller.
({
onClick: function (cmp, evt, helper) {
var allValid = cmp.find('field').reduce(function (validSoFar, inputCmp) {
inputCmp.showHelpMessageIfInvalid();
return validSoFar && inputCmp.get('v.validity').valid;
}, true);
if (allValid) {
alert('All form entries look valid. Ready to submit!');
} else {
alert('Please update the invalid form entries and try again.');
}
}
})This
validity attribute returns an object with
the following boolean properties.
-
badInput: Indicates that the value is
invalid
-
patternMismatch: Indicates that the value
doesn't match the specified pattern
-
rangeOverflow: Indicates that the value is
greater than the specified max
attribute
-
rangeUnderflow: Indicates that the value is
less than the specified min attribute
-
stepMismatch: Indicates that the value
doesn't match the specified step
attribute
-
tooLong: Indicates that the value exceeds
the specified maxlength attribute
-
typeMismatch: Indicates that the value
doesn't match the required syntax for an email or url input type
-
valid: Indicates that the value is
valid
-
valueMissing: Indicates that an empty value
is provided when required attribute is set
to true
Error MessagesWhen an input validation fails, the following messages are
displayed by default.
-
badInput: Enter a valid value.
-
patternMismatch: Your entry does not match
the allowed pattern.
-
rangeOverflow: The number is too high.
-
rangeUnderflow: The number is too low.
-
stepMismatch: Your entry isn't a valid
increment.
-
tooLong: Your entry is too long.
-
typeMismatch: You have entered an invalid
format.
-
valueMissing: Complete this field.
You can override the default messages by providing your own values for these
attributes: messageWhenBadInput, messageWhenPatternMismatch, messageWhenTypeMismatch, messageWhenValueMissing, messageWhenRangeOverflow, messageWhenRangeUnderflow, messageWhenStepMismatch, messageWhenTooLong.
For example, you want to
display a custom error message when the input is less than five
characters.
<lightning:input name="firstname" label="First Name" minlength="5"
messageWhenBadInput="Your entry must be at least 5 characters." />The following input types are not supported.
- button
- hidden
- image
- reset
- submit
Use lightning:button instead for input
types button, reset, and submit.
Additionally, when working with checkboxes, radio buttons,
and toggle switches, use aura:id to group and
traverse the array of components. You can use get("v.checked") to determine which elements are checked or unchecked
without reaching into the DOM. You can also use the name and value attributes to
identify each component during the iteration. The following example groups three
checkboxes together using aura:id.
<aura:component>
<fieldset>
<legend>Select your favorite color:</legend>
<lightning:input type="checkbox" label="Red"
name="color1" value="1" aura:id="colors"/>
<lightning:input type="checkbox" label="Blue"
name="color2" value="2" aura:id="colors"/>
<lightning:input type="checkbox" label="Green"
name="color3" value="3" aura:id="colors"/>
</fieldset>
<lightning:button label="Submit" onclick="{!c.submitForm}"/>
</aura:component>You
must provide a text label for accessibility to make the information available to
assistive technology. The label attribute
creates an HTML label element for your input
component.
MethodsThis component supports the following
methods.
focus(): Sets the focus on
the element.
showHelpMessageIfInvalid():
Shows the help message if the form control is in an invalid state.


 ).
).